A Network Graph of Ancient Empires and Events
I’ve recently started creating a network graph that maps relationships between events, kingdoms, and empires from Mesopotamia to the Roman Principate. It’s not overly extensive, but it offers a starting point for exploring this period. The graph is a simple, shareable file designed for historians or anyone interested in this era.
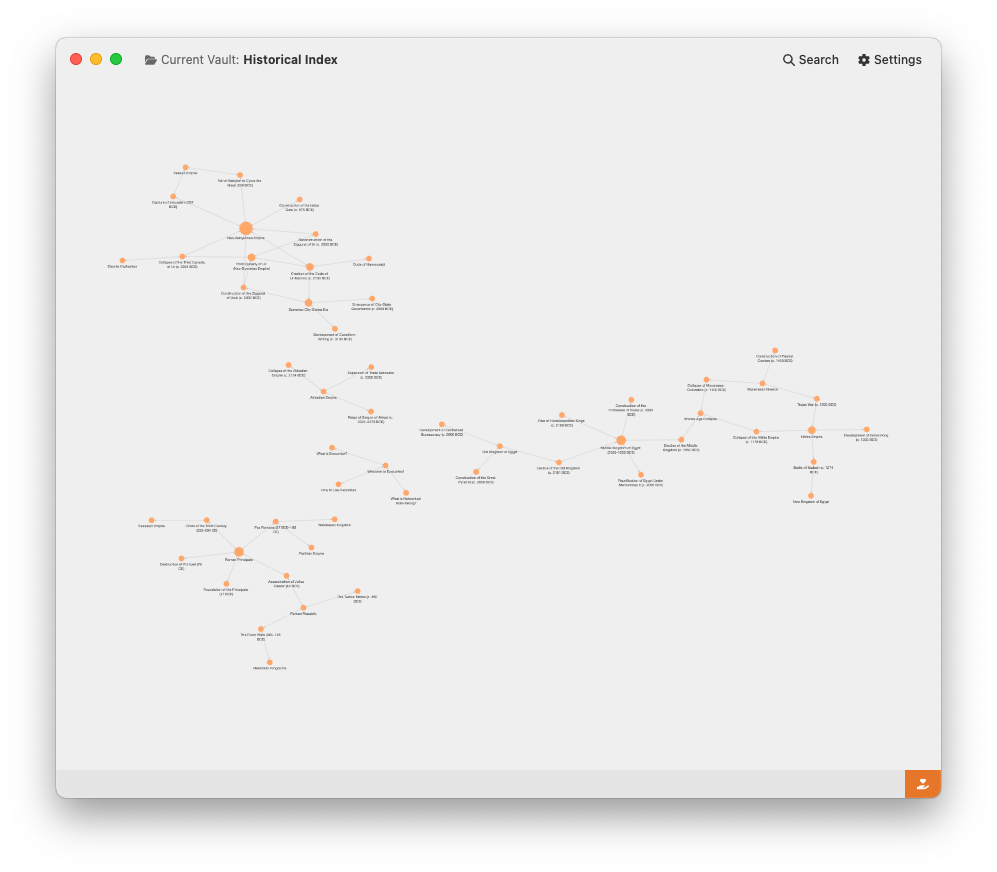
What it shows
The graph organises:
- Empires: Mesopotamian kingdoms, Assyria, Babylon, Persia, Rome, and others.
- Key Events: Conquests, treaties, and cultural shifts.
- Connections: How empires influenced each other—through war, diplomacy, or trade.
Each note in the graph links to others, showing how history overlaps and interconnects. It doesn’t delve too deeply but provides a clear outline of the relationships between major historical players.
Why use a graph?
A network graph works well for history because it visualises connections in a way that timelines and lists can’t. For example:
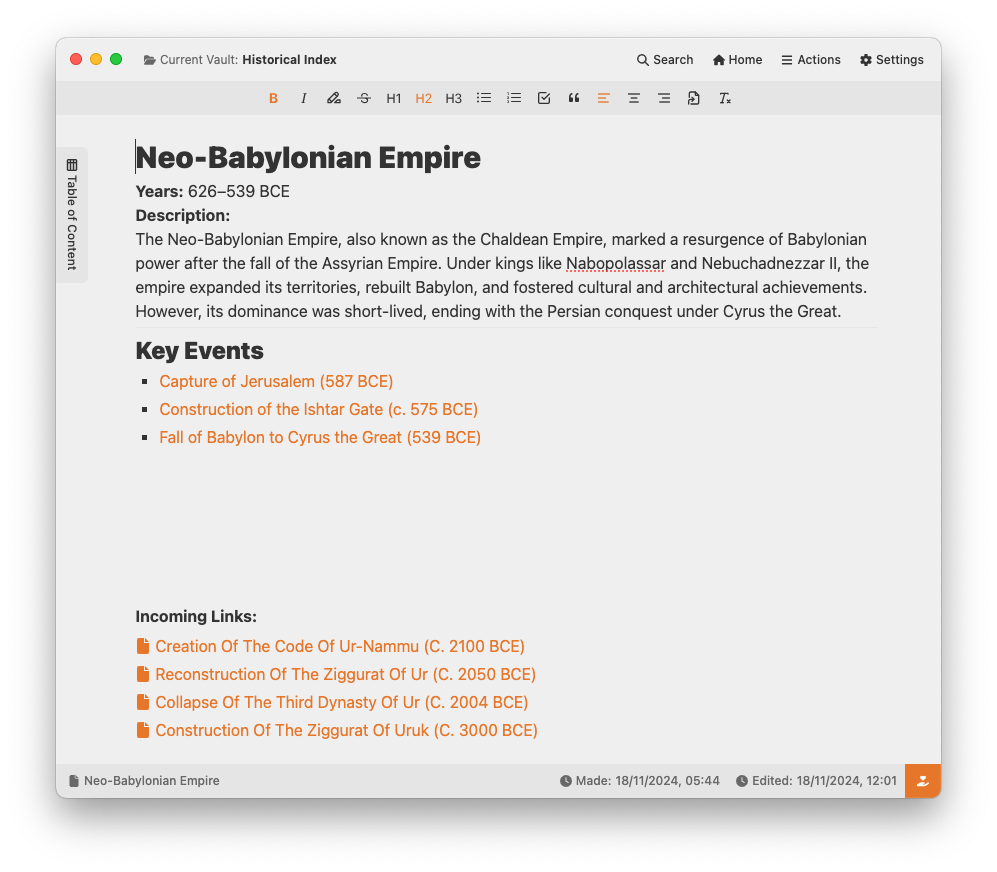
- The rise of the Persian Empire connects to the fall of Babylon and Alexander the Great’s campaigns.
- Rome’s Principate interacts with earlier influences like the Hellenistic world.
Instead of static notes, this graph makes it easier to explore how events and empires relate to one another.
How can it be used?
The graph is both a tool and a starting point. You can:
- Use it to study the period and better understand its key dynamics.
- Expand on it by adding your own notes and details.
- Adapt it as a template for exploring other historical eras.
It’s a single file that can be shared online, making it portable and useful for individuals or small groups.
Behind the scenes
I built the graph using a note-taking app I’ve worked on. It saves notes and graphs in one encrypted file, making them easy to share or adapt while keeping the data secure. The app supports linking ideas visually, which is ideal for this kind of work.
Final thoughts
This graph offers a practical way to see how empires and events connect. It’s useful for anyone studying ancient history or looking for a structured starting point. If you’d like to try it or adapt it for your own use, it’s ready to download and explore.
- Download the Exocortex app here
- Download the historical index graph here
- The file password is
not a password
- The file password is